Consumables Stock Card: Receipts, Issues, Balance and Reorder Alert
A free Excel stock card that records receipts and issues for each consumable, calculates the balance and shows “ORDER NOW” when it falls to the reorder point; fields, estimating usage and lead time, and reconciling with a count.
What is a consumables stock card?
A stock card is the record that keeps one item’s identity (code, name, unit, pack, location), its stock rule (usage, lead time, safety stock) and every receipt and issue of that item in one place. It is also called a bin card or stock record card. The balance is calculated from the movements; when the balance falls to the reorder point or below, the item shows “ORDER NOW”. The Excel workbook below does this for 40 items and 300 movement rows; you enter usage, lead time and safety stock, and the file suggests none of them.
Free consumables stock card (Excel)
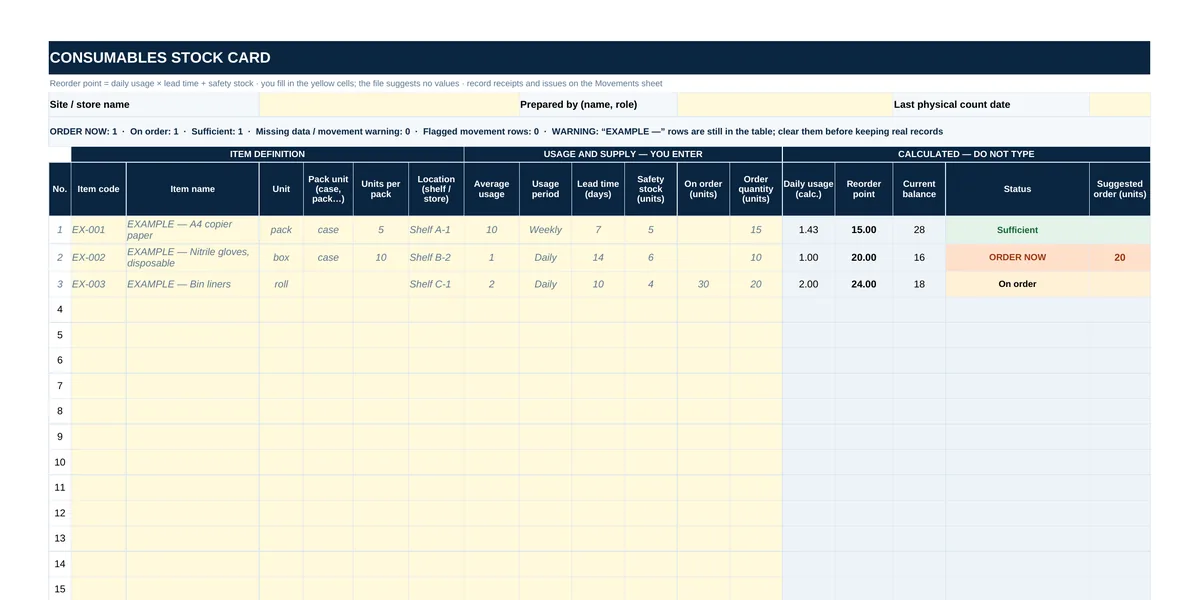
Fill in one row per item on the Items sheet and one row per receipt or issue on the Movements sheet. Balance, reorder point, status and suggested order are calculated for you; an unknown code, a row with both a receipt and an issue, and a negative balance are flagged. The Items sheet prints A4 landscape, Movements A4 portrait; no sign-up.
The workbook is a stock tracking tool; it suggests no usage, lead time, safety stock or order quantity. Rows starting “EXAMPLE —” are examples and their figures are not recommendations: clear the input cells and enter your own items.
 — open full-size image
Which fields belong on a stock card?
A stock card lives in two places: the item’s rule (Items sheet) and the item’s movements (Movements sheet). Keeping them apart means that when an item’s usage or lead time changes you correct a single cell; past movements stay as they were.
| Field | What to enter | Why it is needed |
|---|---|---|
| Item code | One unique code per item, chosen by you | Movements are matched to the item by this code; if a code is not unique, nobody can tell whose balance it is, so the file flags duplicates |
| Item name | The name you use when ordering | Appears automatically on the Movements sheet next to the code, so a wrong code is spotted at once |
| Unit | The counting unit: each, pack, box, roll, kg and so on | Receipts, issues and the balance are all kept in the same unit |
| Pack unit and units per pack | Case, pack, pallet; 12 if a case holds 12 units | If filled in, the suggested order is rounded up to whole packs |
| Location | Shelf or store | To find the item at count time |
| Average usage and period | Average daily or weekly issues | First input of the reorder point; a weekly figure is divided by 7 |
| Lead time (days) | Days from placing the order to goods entering the store | What is used up during this time goes into the reorder point |
| Safety stock | Your decision; if left blank the item shows “Missing data” | Buffer against deviations in usage and lead time |
| On order | Quantity ordered but not yet received | Stops the warning from repeating after the order has been placed |
| Order quantity | The amount you want to buy in one order | The base of the suggested order |
Yellow cells are yours; Daily usage, Reorder point, Current balance, Status and Suggested order are formula columns.
On the Movements sheet each row is one movement: date, item code (drop-down list from Items), receipt or issue, and a description or document number (delivery note, issue slip). Take the opening stock from a physical count and enter it as the first movement, as a receipt; from then on the balance changes only through movements.
Balance, reorder point and status
The current balance is the total of all the item’s receipts minus the total of all its issues; it is never typed in. The threshold that triggers the order is the reorder point:
Reorder point = daily usage × lead time (days) + safety stock
This is the same formula the spare parts min/max and reorder point calculator uses. Why safety stock should follow the variability of usage and lead time rather than their averages, and how a service level turns that into a number, is explained there and not repeated here. What this workbook adds is that the formula runs for every item at once, is compared with the balance, and the result shows in a single column.
| Status | When | What to do |
|---|---|---|
| ORDER NOW | Balance plus quantity on order is at or below the reorder point | Order the quantity in the Suggested order column, then enter it under On order |
| On order | The balance is at or below the reorder point, but balance plus quantity on order is above it | Wait; when the goods arrive, record the receipt and reduce On order |
| Sufficient | The balance is above the reorder point | Nothing to do |
| Missing data | Usage, period, lead time or safety stock is missing or invalid; or the code is blank or used twice | Fill in the field named in the status cell |
| Movement warning | The item has a flagged row or a negative balance on the Movements sheet | Read the Check column on the Movements sheet |
Status counts the quantity on order too: once an order is placed, the item does not keep saying ORDER NOW every time you open the file until the goods arrive.
Suggested order = reorder point + order quantity − (balance + on order); it appears only while the status is ORDER NOW. This is the “max = min + order quantity” rule of the min/max convention (min = reorder point): when stock falls to the reorder point, you order enough to bring the stock position back up to the maximum.
| Example item | Balance | Reorder point | Status | Suggested order |
|---|---|---|---|---|
| EX-001 · weekly usage 10, lead time 7 days, safety stock 5 | 28 | 15 | Sufficient | — |
| EX-002 · daily usage 1, lead time 14 days, safety stock 6, order quantity 10, case = 10 units | 16 | 20 | ORDER NOW | 20 (2 cases) |
| EX-003 · daily usage 2, lead time 10 days, safety stock 4, on order 30 | 18 | 24 | On order | — |
These figures are EXAMPLE rows placed in the file only to show how the calculation works; they are not a usage, lead time, safety stock or order quantity recommendation.
On the first row the weekly 10 units become 10 ÷ 7 per day; 10 ÷ 7 × 7 + 5 = 15. On the second row the balance (16) is below the reorder point (20); 20 + 10 − 16 = 14, and because the item comes in cases of 10 the suggestion is rounded up to 20.
How to estimate usage and lead time
The workbook does not calculate usage or lead time; both come from your own records. The method is the same for both: past records, not guesswork.
- Average usage. Divide the total issues in a period by the number of days in that period. Filter the Movements sheet on the item code and select the Issue column; Excel shows the sum in the status bar. Choose calendar days or business days and use the same definition for the lead time.
- Choosing the period. For an item whose usage changes with the season or with campaigns, take a period long enough to cover the swing, or work out the periods separately and enter a separate figure for the busy season; you only change one cell on the Items sheet.
- Stock-out days. While the item is out of stock, no issues can be recorded; counting those days makes usage look lower than it is. Leave stock-out days out of the period.
- Count adjustment rows. An issue you enter to close a count shortage is not real consumption; write “Count difference” in its description and keep it out of the usage total.
- A new item with no history. Treat the first estimate as an opening assumption and replace it with actual issues as records build up.
- Lead time. The gap between the date the order was placed and the date the goods entered the store (the receipt on Movements). Look at your recent orders as a whole, not at a single one. The lead time a supplier states in its quote can be the first value; if actual deliveries take longer, enter the figure from your own records. How much the lead time varies is what drives safety stock: see the spare parts min/max and reorder point calculator.
- How often you open the file. The workbook sends no notifications; you see the warning when you open it. If you look once a week, up to a week can pass between the item falling below the reorder point and you noticing and placing the order; add that time to the lead time or cover it in safety stock.
Safety stock is your decision
Safety stock is the buffer that keeps you from running out when usage or lead time deviates from what you expected. Its size is a decision before it is a formula: it depends on what running out of the item costs you and on how predictable the lead time is. That is why the workbook leaves this cell blank and does not treat a blank cell as zero; it says “Missing data”. If you want zero on purpose, type 0.
An item whose absence stops work and an item whose absence is a minor inconvenience do not deserve the same buffer; separate your items on that basis and think about the critical ones on their own. For a statistical estimate from your own usage and lead-time spread, the spare parts min/max and reorder point calculator works out safety stock, reorder point and min/max from your inputs.
Ordering in pack units
If an item is sold in cases, packs or pallets, the order quantity has to be a whole number of packs. When “Units per pack” is filled in, the workbook rounds the suggested order up to the next whole pack; when it is blank, it rounds up to the next whole unit.
Rounding up creates surplus. How far the real unit cost drifts from the list price once the time the surplus sits on the shelf and the supplier’s minimum order quantity are taken into account is what the minimum order quantity and pack size calculator shows.
Reconciling with a physical count
The balance is only as accurate as the movements entered. If it does not match a physical count, work in this order:
- Enter every receipt and issue up to the count date on the Movements sheet; during the count, stop goods receipt and dispatch or keep them separate.
- Compare the item’s physical count with the current balance on the Items sheet.
- If there is a difference, look for the cause first: an unrecorded receipt or issue, a unit error (cases entered as units), a late return or a write-off, or a genuine loss.
- If the cause is a recording error, correct that movement. If it is a genuine loss or a count surplus, close it with a single movement: a receipt for a surplus, an issue for a shortage; write “Count difference”, the count date and the count sheet number in the description.
- Enter the count date in the “Last physical count date” field on the Items sheet.
Warnings and incomplete rows
The summary line at the top of the Items sheet gives the number of items at ORDER NOW, On order and Sufficient, the number of items with missing data or a movement warning, and the number of flagged rows on Movements; it also tells you if “EXAMPLE —” rows are still there. On the Movements sheet the Check column of each row shows one of these:
| Message | Meaning |
|---|---|
| OK | Nothing wrong with the row |
| Code? · No * ? ~ in code | The item code is blank, or it contains characters that break the totalling formulas |
| Unknown code | The code is not defined on the Items sheet; the row counts in no item’s balance |
| Receipt and issue both filled | Both are on the same row; leave one blank |
| Receipt/issue? | Both are blank |
| Quantity? | The quantity is not a number or not greater than zero |
| Date? | The date is missing or not valid |
| Negative balance | On that date issues exceed receipts: a receipt may be missing, an issue wrong or the date incorrect |
A flagged row still counts in the balance (except a row with an unknown, blank or * ? ~ code), but the item’s status shows neither ORDER NOW nor Sufficient until it is corrected. Negative balances are checked by date, so rows do not have to be entered in date order.
Stock card, bin card and stores ledger
The names overlap. In cost-accounting usage, a bin card is kept by the storekeeper at or near the storage location and records quantities only: receipts, issues and balance. The stores ledger is kept by the accounts side and records quantities and values. “Stock card” is used for either. This workbook tracks quantities only, so it sits on the bin card side: it does not value stock and does not replace your accounting records.
From the supplier’s side
Regularly used items (office and stationery, cleaning and hygiene, safety and PPE, industrial consumables) are what a stock card is naturally used for. AKSCO is a corporate supplier based in Türkiye and does not hold stock in a warehouse of its own; we take your requirement list, source the items and return a written quote line by line within 1 business day, with the lead time of each line stated separately. Send the list of items showing ORDER NOW (item name, unit and suggested quantity); you can also send the table as an Excel file.
The lead time on our quote can be the first value in your Lead time cell; enter the average you actually see from your own order records, and let safety stock cover the spread. We deliver across Türkiye’s 81 provinces and ship abroad under the Incoterm agreed for the order. A quote request creates no obligation to order. Scope: Office & Stationery Supplies, Cleaning & Hygiene Products, Safety Equipment & PPE, Industrial MRO & Spare Parts.
Scope and limits
This page and workbook are a stock tracking tool that keeps item-level receipts and issues and a reorder warning. They suggest no usage, lead time, safety stock or order quantity; the suggested order is calculated only from the values you enter. The workbook does not forecast demand; results depend only on what you enter. It sends no notification or e-mail: the warning appears in the Status column when you open the file. It tracks quantities only: there is no unit cost, stock valuation or amount. It is not an accounting record or a statutory inventory document, and it does not track expiry dates or batches.
Frequently Asked Questions
How do I set up a minimum stock alert in Excel?
Calculate a reorder point for each item (daily usage × lead time + safety stock) and compare the balance with it. In this workbook the Status column shows “ORDER NOW” when balance plus quantity on order falls to the reorder point or below. The reorder point adds to the safety stock what will be used up until the order arrives; the warning appears when you open the file, and the file sends no notifications.
How do I find average usage and lead time?
From your own records: usage is the total issued in a period divided by the number of days in it; lead time is the gap between the order date and the date the goods entered the store, looked at across your recent orders rather than a single one. Stock-out days are left out of the usage period. The workbook does not suggest these values.
What should I enter as safety stock?
The workbook does not say, because it is a decision that depends on what running out of the item costs you and how predictable the lead time is. If you leave the cell blank the file shows “Missing data”; if you want zero on purpose, type 0. For a statistical estimate, use the spare parts min/max and reorder point calculator.
I placed the order but the item still shows ORDER NOW. Why?
The balance stays at or below the reorder point until the goods are received. Enter the quantity you ordered under On order; if balance plus quantity on order is above the reorder point, the status becomes “On order”. When the goods arrive, record the receipt and reduce or clear On order.
What if the physical count does not match the balance?
Look for the cause first: an unrecorded receipt or issue, a unit error, a late return or write-off, or a genuine loss. Correct recording errors; close what remains with a single movement (a receipt for a surplus, an issue for a shortage) and write “Count difference” in the description. Keep these rows out of the usage calculation.
Is a stock card the same as a bin card?
The terms overlap. In cost-accounting usage a bin card records quantities only and is kept in the store, while the stores ledger records quantities and values and is kept by accounts. This workbook tracks quantities only.
Does AKSCO hold stock, and how do I send the items showing ORDER NOW?
AKSCO does not hold stock in a warehouse of its own; it is a corporate supplier in Türkiye that works from your item list. Send the items showing ORDER NOW (item name, unit and suggested quantity) through the quote request form, or e-mail the table as an Excel file; we quote line by line, with the lead time of each line stated separately.
Related guides
Stock Count Sheet Template
Free Excel count sheet: variance, variance % and accuracy rate.
Read moreExpiry Date Tracking Sheet
Batch-level label dates, status and FEFO rank: the neighboring file that tracks dates, not movements.
Read moreSpare Parts Min/Max and Reorder Point Calculator
Safety stock from usage and lead-time spread, reorder point and min/max for one item.
Read moreMinimum Order Quantity and True Unit Cost Calculator
What pack rounding and a supplier minimum do to the real unit cost.
Read moreWhat Is MRO? Industrial Consumables Explained
How MRO supply differs from direct materials, the six MRO groups and a two-axis classification.
Read morePurchase Request Form Template
Put a department’s need in writing and get it approved before it reaches purchasing.
Read moreHygiene Consumables Consumption Calculator
Monthly toilet paper, hand towel, soap and bin liner use from headcount: a starting usage figure before your own records build up.
Read moreIndustrial MRO & Spare Parts
Line-by-line quotes for regularly used consumables and spares.
Read moreSend your list — your quote is ready within 1 business day.
A list, a photo or an Excel file — whatever is easiest. On standard items we aim to quote the same business day. Custom production, imports or 50+ line lists can take longer; when they do, we tell you the timeline in writing on the day we receive the request.